ENVIRONMENTAL SUSTAINABILITY
Heat Islands and School Microclimates: A Practical Guide with P-Bit
By POWAR STEAM
•
March 5, 2026
•
3 min read
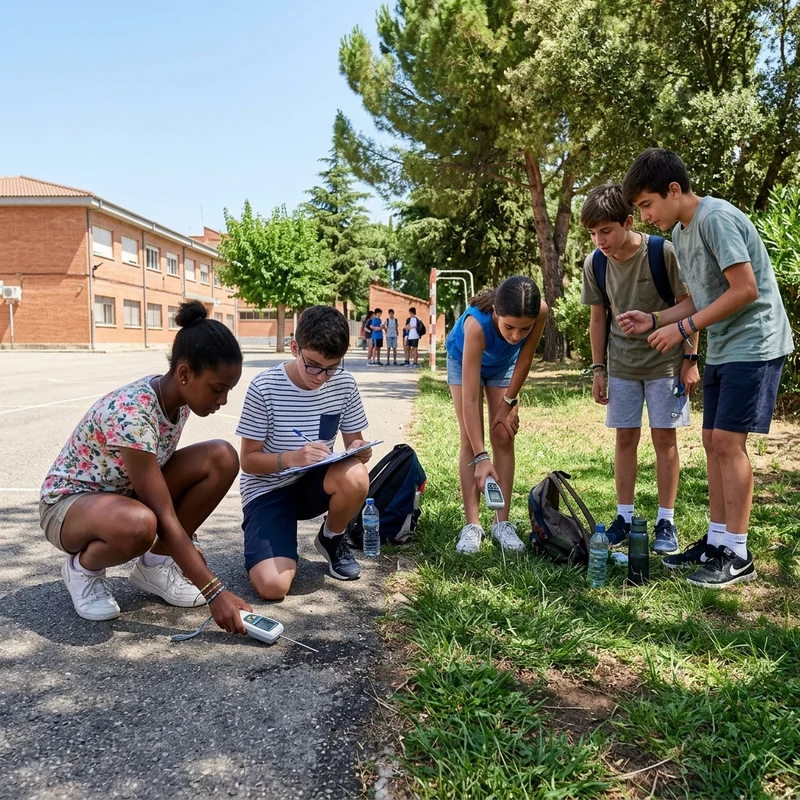
The Urban Heat Island (UHI) phenomenon isn't just theory from Geography or Environmental Science textbooks. It happens daily just a few metres from the classroom: the temperature difference between the concrete of the school playground and a landscaped or tree-covered area can easily exceed 4°C or 5°C during the midday hours.
In this article, we explain how to turn the school playground into a living laboratory where students use the P-Bit · Environmental mini-computer to measure, analyse, and propose nature-based solutions.
When we explain climate change and urban warming in purely abstract terms, we risk generating eco-anxiety in students. Introducing portable IoT sensors changes the approach entirely:
Students record drastic temperature variations across less than 50 metres within the school grounds. This lets them understand the concept of microclimate with first-hand data.
Divide the class into groups of 3 or 4 students. Each team assigns a P-Bit to a specific area of the school:
Thanks to the P-Bit's built-in TFT screen, students see the values instantly without needing to connect any cables. Each group notes down the readings from its station to compare them later in class. Data Dashboard, for seeing every group's data at once on the projector, is in development.
By consolidating the measurements in a shared table, students observe direct scientific correlations:
The project culminates in a proposal phase. Students use the collected data to draft a formal proposal to the school leadership or the local council: