LOMLOE RESOURCES
How to Build a Biology and Technology Learning Situation with Real Data from the P-Bit
By POWAR STEAM
•
February 20, 2026
•
3 min read
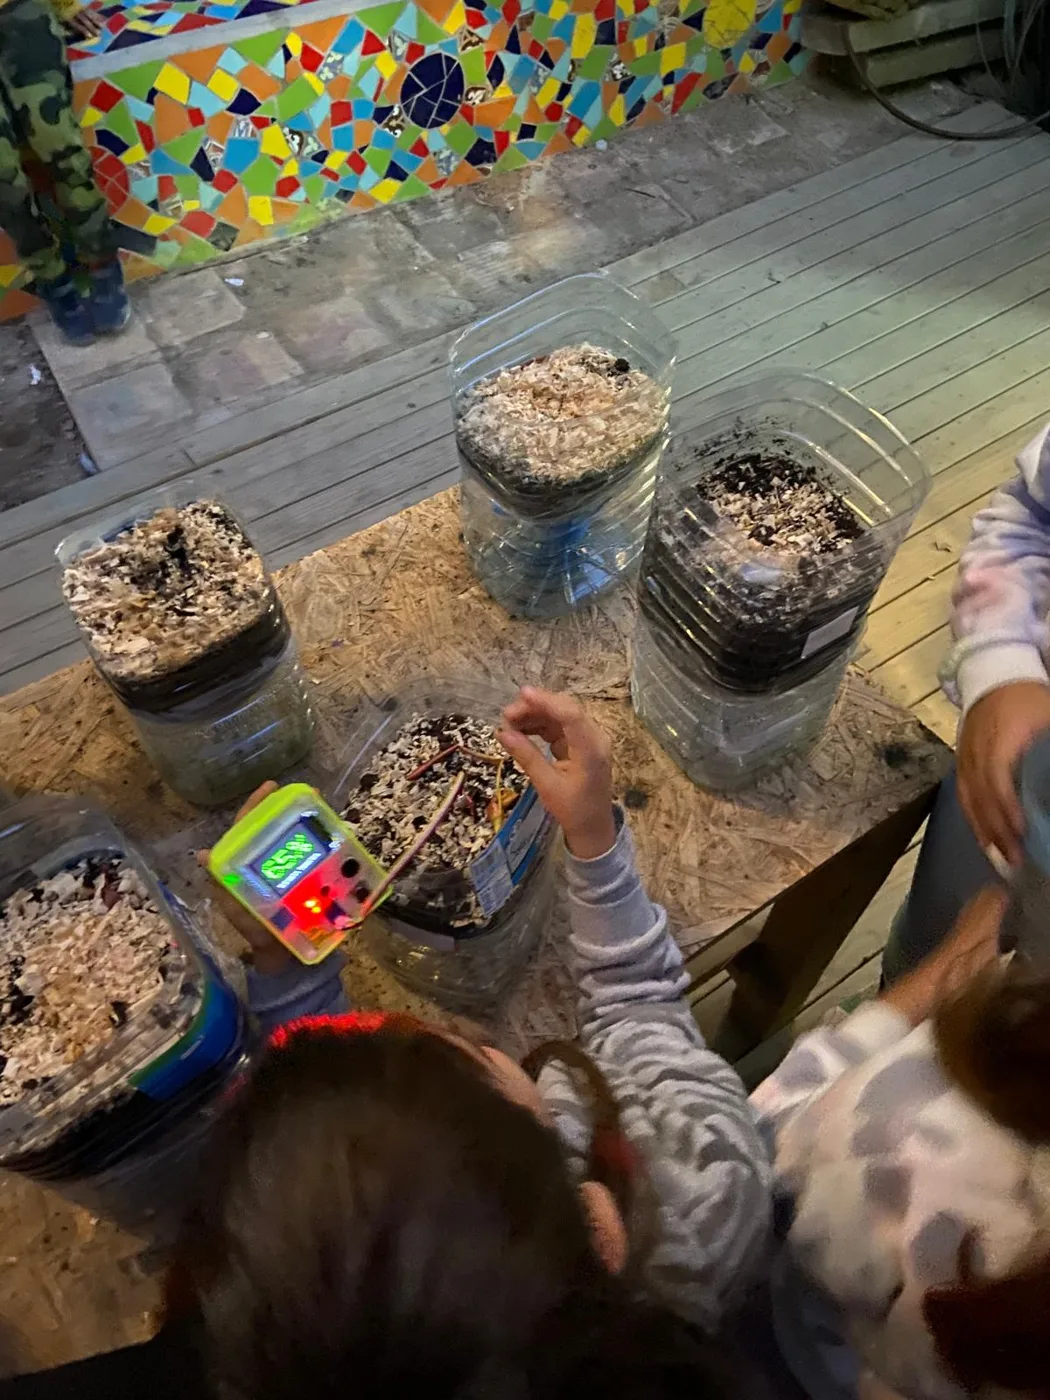
With the consolidation of the LOMLOE curricular framework, teaching planning has definitively shifted from traditional rote learning toward Learning Situations (SA): didactic sequences based on real-world challenges, collaborative work, and the verifiable acquisition of key competencies.
However, for many Biology, Geology, Physics, or Technology teachers in ESO and Bachillerato, the greatest difficulty lies in the documentation bureaucracy and in finding a practical trigger that connects the Basic Knowledge with students' own experience.
A competency-based Learning Situation must meet four fundamental requirements:
"Is our classroom ready to withstand heatwaves without air conditioning? Analyse thermal comfort with the P-Bit and present a passive cooling proposal."
Presenting the challenge. Students discuss which factors influence the classroom's thermal comfort and draft initial hypotheses. Powering on the P-Bit and a first visual inspection of the TFT screen.
Students configure the temperature and humidity sensors on the P-Bit. Using P-Blocks (the visual block-based coding platform), they program a simple conditional: IF temperature > 25°C TURN ON alert buzzer.
Each team notes down the values on the P-Bit's screen at set times during the day, copies them into a spreadsheet and builds comparative charts of how they change over time. Data Dashboard, which will export these records to CSV directly, is in development.
Presentation of the final report by teams and self-assessment using a competency rubric.
We know that writing up the curricular justification for an SA takes valuable time. That's why the POWAR STEAM ecosystem includes the PowarED (AI for teachers) platform: