STEAM & WELLBEING PROJECTS
Monitoring Environmental Quality and Noise in the Classroom
By POWAR STEAM
•
January 15, 2026
•
2 min read
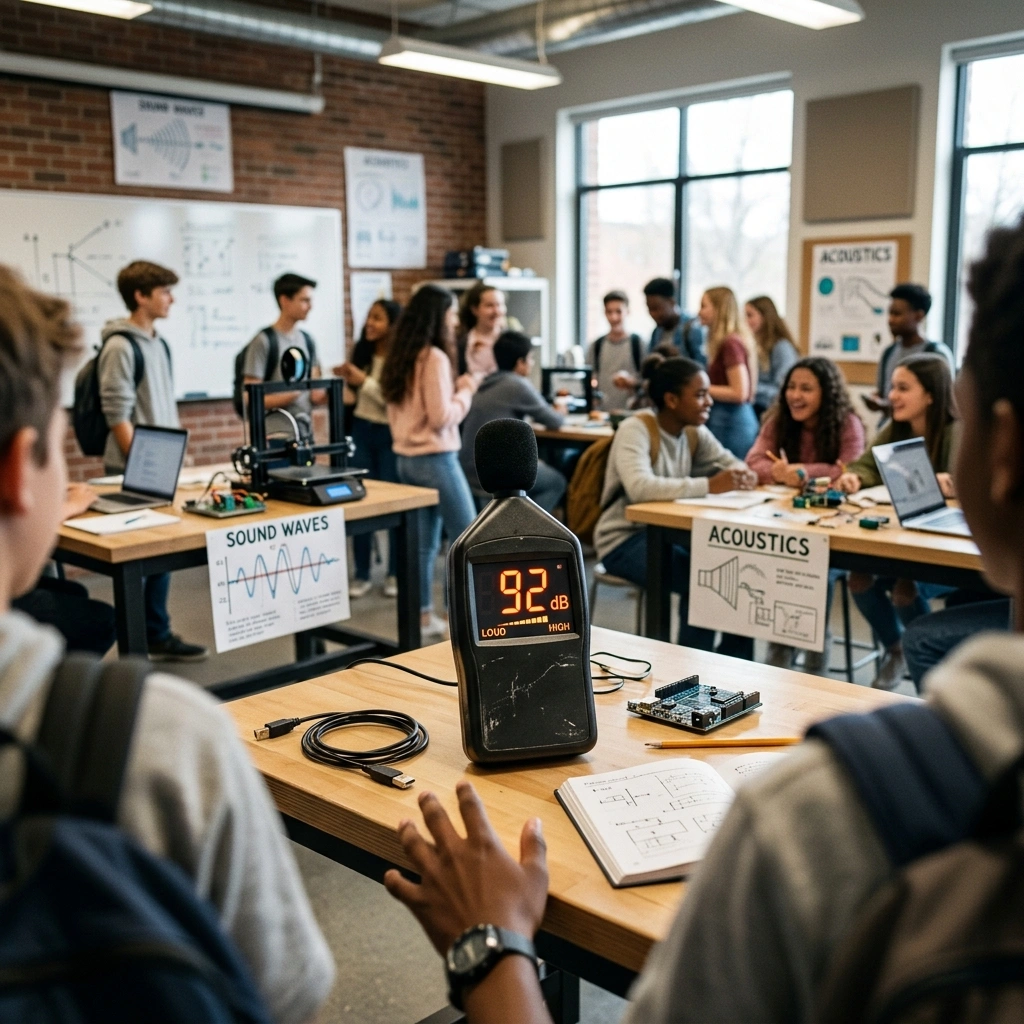
Excessive noise in hallways and classrooms isn't just annoying: according to neuroeducational studies, levels above 65 dB reduce reading comprehension and increase cognitive fatigue in both students and teachers.
In this hands-on project, we explain how to use the P-Bit's native microphone (Mic) and comfort sensors to build a sound traffic light and an acoustic health map of the school.
Unlike digital sensors such as the DHT11, the P-Bit's microphone captures the wave amplitude of ambient sound and translates it into a continuous analog signal (ADC). This lets students grasp the physical concept of frequency and sound pressure intuitively.
On the P-Bit's built-in screen, acoustic intensity is shown as an animated bar indicator or through the RGB LED changing colour (Green = Comfort, Yellow = Caution, Red = Excessive Noise).
Using the P-Blocks visual coding platform, students build the sound traffic light code in just 5 minutes:
READ Microphone (Analog) in a continuous loop.IF Noise < Silence_Level → Turn on Green LED (Calm).IF Silence_Level < Noise < Alert_Level → Turn on Yellow LED.IF Noise > Alert_Level → Turn on Red LED + Warning buzzer.Each team moves its P-Bit to different areas throughout the school day (cafeteria, library, gym, hallways during class changes) to gather real acoustic intensity readings and tabulate decibel peaks.
The project concludes with a collective analysis where students design informational posters and present noise self-regulation recommendations to the school community.